

Weekly Market Commentary August 31, 2026
LPL Research explores why value stocks are outperforming, how free cash flow drives returns, and the impact of AI spending on markets.

Last Edited by: LPL Research
Last Updated: August 31, 2026
The Cash Flow Case for Value
LPL Research explores why value stocks are outperforming, how free cash flow drives returns, and the impact of AI spending on markets.
A regime in transition. Value has reasserted itself into the market's psyche after a long period in which growth leadership felt permanent.
Growth's run was the exception. Growth's leadership since the 2010s was a relatively rare period, helped by falling rates, software multiple expansion, and the rise of asset-light platform companies.
Investors are repricing risk. However, markets are regime-sensitive, and the market regime appears to be shifting as investors have become more sensitive to technology valuations, AI-related capital spending, and the durability of free cash flow.
Cash generation over promises. This rotation is the market repricing the relative value of near-term cash generation versus long-duration earnings promises.
Value through a factor lens. Of course, “value” can mean different things. In our view, analyzing value as a factor is more instructive, and here, we contextualize recent value outperformance, analyze cash flow as a value factor, and connect these learnings to today's dominant investment debate: the AI capital expenditures (capex) cycle.
Value is Back in Style: The Rotation in Context
Should the recent value rotation be viewed as a regime shift-driven change in market preference, or a simple reversal trade? We think there is a compelling case to be made for the former. In a regime of higher interest rates and stubbornly above-target inflation, the market is increasingly focused on capex intensity, free cash flow conversion, and the cost of capital. Therefore, it makes sense that companies with visible cash generation have broadly regained relative appeal. This does not mean "growth" stocks cannot work. After all, growth is a core component of determining intrinsic value for a diligent stock operator. It simply means investors are less willing to pay premium multiples for earnings streams that require rising amounts of reinvestment to sustain in a "higher for longer" interest rate environment.
As a quick trip down memory lane, the Russell 1000 Growth Index outperformed the Russell 1000 Value Index by ~675% cumulatively from the late 2010s through the end of last October. The market regime during the majority of this period was one of low economic growth, low interest rates, and subdued inflation, and the U.S. equity market was fixated on software platforms that delivered consistent earnings growth with minimal reinvestment requirements that allowed for generous share repurchases. More recently, since roughly the end of 2022, artificial intelligence (AI) further supported growth outperformance, despite the burgeoning shift in the macro regime as inflation and interest rates began to rise. This new regime solidified as inflation remained sticky and the Federal Reserve maintained higher interest rates. Simultaneously, the capex required for the AI buildout continued to grow, and hyperscale cloud businesses ("hyperscalers") continued to invest at a faster pace to meet the compute demanded by AI labs.
This brings us to 2025, when slowly but surely, investors started to question just how much capital this new technology would require, what kind of returns should be expected from this invested capital, and how long will it take to show up? This increased level of scrutiny presented itself in equity index performance starting late last year as the equal-weighted S&P 500 began outperforming the traditional market-cap-weighted S&P 500 as the market broadened out. However, the value vs. growth performance reversal was even more stark. As shown in the "Value Has Taken Over Leadership in the Current Regime" chart, since last October, the growth index has generated total returns of just 0.8%, while the value index has generated total returns of 28%.
Value Has Taken Over Leadership in Current Regime
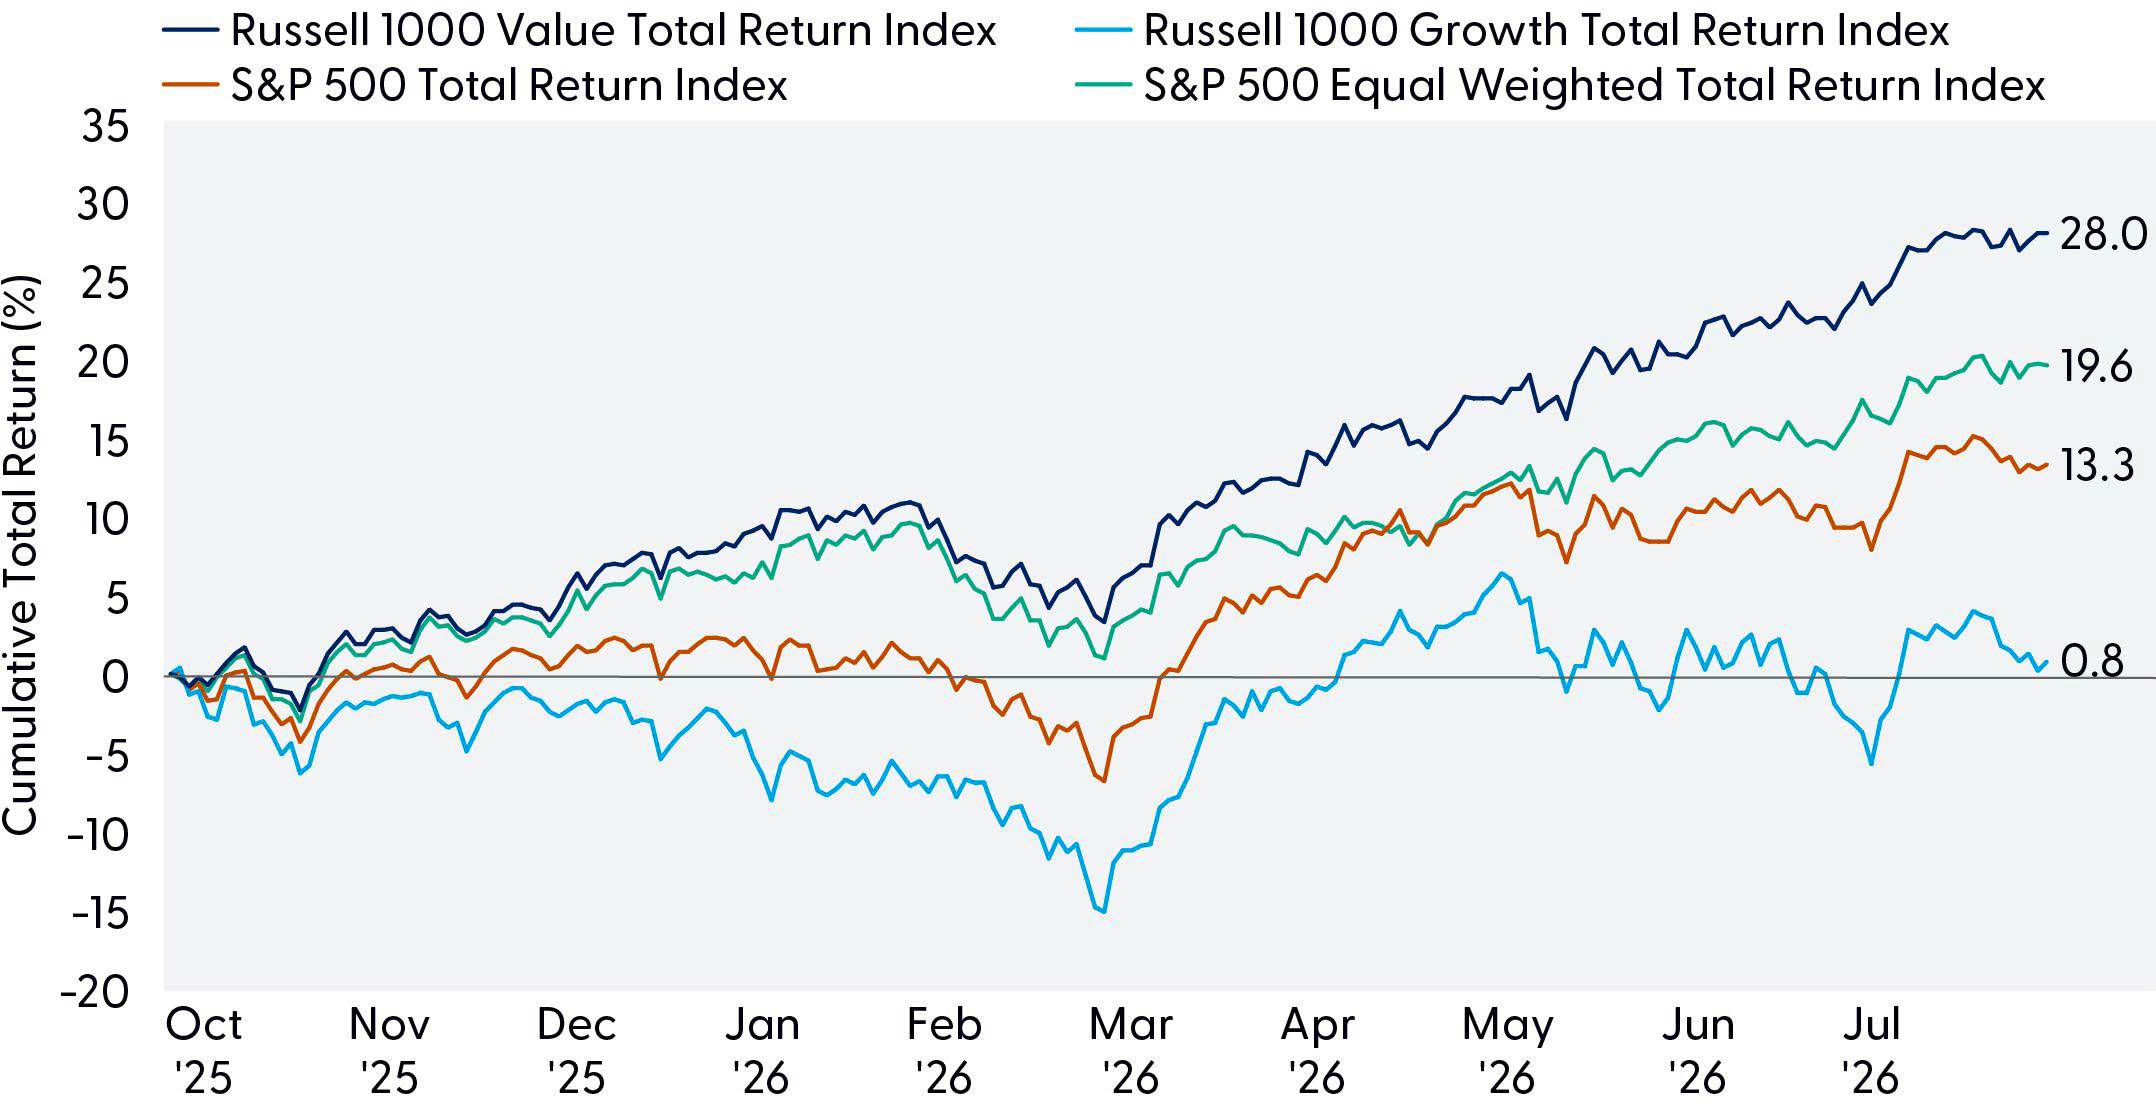
Source: LPL Research, Bloomberg 08/25/26; Daily Total Returns, Cumulative, 10/31/25-08/25/26
Disclosures: All indexes are unmanaged and cannot be invested in directly. Past performance is no guarantee of future results.
A few moving pieces have been in play here. There is index concentration: the value index is much less concentrated than the growth index. And there's sector composition: growth is far more heavily tilted toward information technology relative to value, while the top-performing sectors over the period (energy and materials) are value sectors, broadly speaking. Don't forget idiosyncratic security "selection": cyclical memory chip and storage companies that put up 3x-7x returns during the period and were solely constituents of the value index up until the late June 2026 Russell FTSE Index reconstitution. These dynamics are easy to accept, but they are simply narratives describing bits and pieces of the broader story, which is that the market is in the early innings of a new regime.
We know the value style can outperform when the value-favored corners of the market (such as banks, energy and materials companies, industrials, and defensive cash generators) outperform. But what value style indexes don't teach us is what valuation metrics are telling us about intrinsic value, and on what metrics investors should focus their efforts. In other words, what we want to understand is which definition of value earnings, free cash flow, or book value, for example is doing the heavy lifting. This is where quantitative factor analysis shines.
Value Factors: Why FCF Yield Deserves the Spotlight
Quantitative investors typically focus on factors, which are quantifiable characteristics that explain what likely drove a stock's returns. The most frequently used types of characteristics are fundamental factors, such as value and quality (profitability, leverage, etc.), and market factors, such as momentum (trailing price-based returns) and volatility. Some factors, such as value and size, typically combine both. Our focus is on the value factor, which was one of the first factors academically studied in the seminal work of Eugene Fama and Kenneth French in the early 1990s.
To set the stage for our brief analysis of value factors, we will focus on fundamental metrics relative to price or enterprise value (EV), including:
• Earnings yield (EPS/price, the inverse of the popular price-to-earnings (P/E) ratio), which asks how much accounting profit a company generates relative to price,
• Book yield (book value per share/price), which asks what is the net asset value (assets minus liabilities) of the business relative to the value the market is pricing, and
• FCF yield (free cash flow (FCF)/EV), which asks how much cash remains after the business funds the capex required to operate and grow
Among value factors, free cash flow (FCF) yield has historically been one of the cleaner ways, in our view, to measure what investors are actually buying. This is because, while earnings and FCF yields can be very similar in stable, low-capex businesses, they can diverge significantly in capital-intensive or acquisition-heavy businesses, as well as companies where working capital, stock-based compensation, leases, and depreciation schedules create a wide gap between reported earnings and economic cash generation.
Our factor research, alongside factor returns from our friends at Bloomberg, confirms that FCF has shown better returns and predictive power of forward returns relative to other value factors during this century. The reason FCF yield has outperformed other value factors, in our view, is not a mystery. Intrinsic value is ultimately the present value of future free cash flows. Simply put, FCF yield gets closer to the economic question investors should focus on namely, how much cash can this business produce for owners after reinvestment? That said, FCF is not perfect. FCF can be distorted by working capital timing, underinvestment, and financing choices. However, outperformance in FCF yield since 2003 shows us that it is harder to sustain illusions in cash flows than in accounting-based earnings.
Bringing FCF-focused strategies into our comparison of style indexes, we highlight the Victory U.S. Large Cap Free Cash Flow Total Return Index in the "FCF Yield With a Growth Overlay Works Well in the Current Market Regime" chart. What is interesting about this index is that it focuses on stocks with high FCF yields and then selects a subset of those stocks with the highest historical and expected growth prospects. This approach of FCF-based value, with a growth overlay, appears to play well in the current market regime we find ourselves in, as the strategy kept pace with the growth style in the long-term horizon analyzed (2010 through October 2025) and has broken out from both value and growth style indexes in the shorter time horizon (October 2025 to current).
FCF Yield With a Growth Overlay Works Well in the Current Market Regime
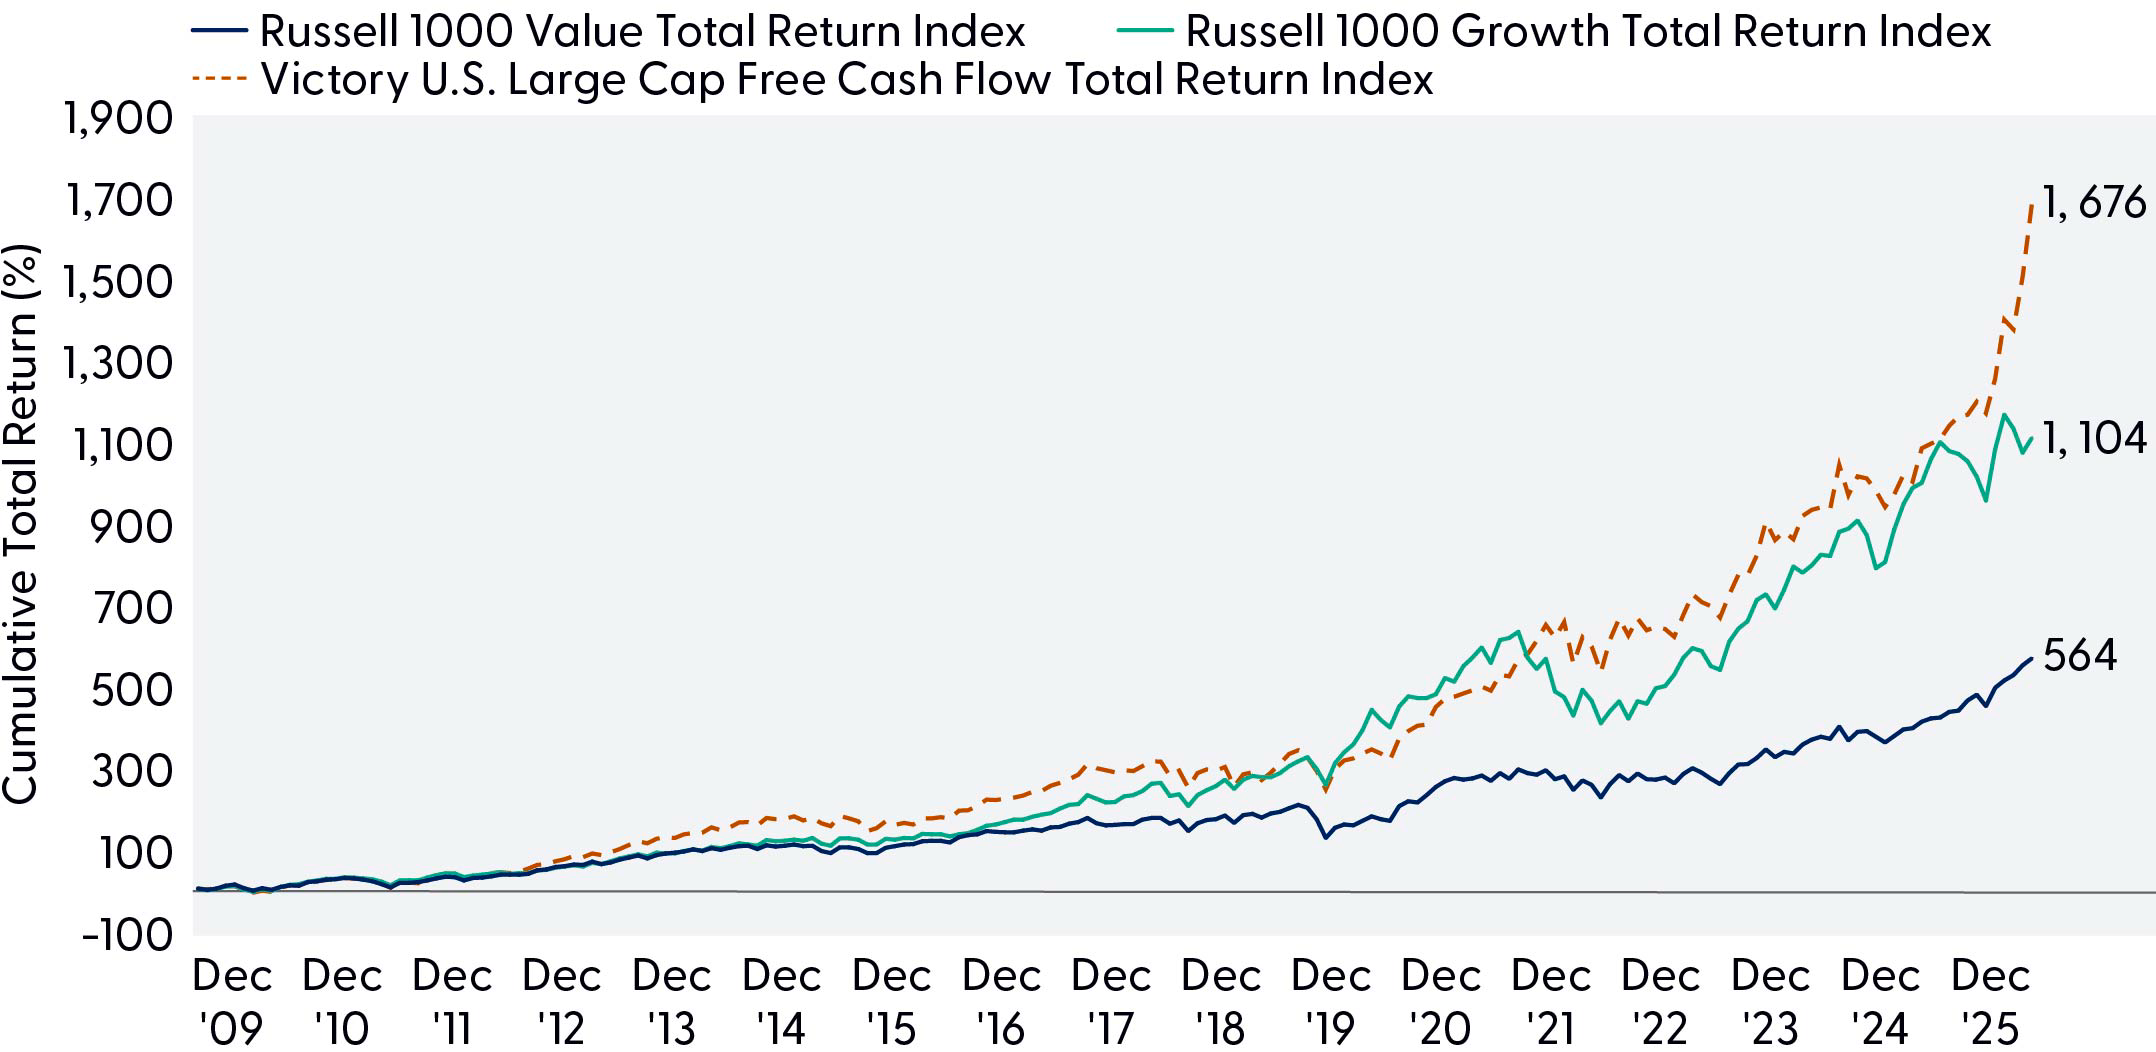
Source: LPL Research, Bloomberg 08/25/26; Monthly Total Returns, Cumulative, 12/31/09-08/25/26
Disclosures: All indexes are unmanaged and cannot be invested in directly. Past performance is no guarantee of future results.
Hyperscalers and the AI Capex Cycle: Cheap on Earnings, Expensive on FCF
Now, let's bring all this together into one of the biggest debates in markets today the hyperscalers' investment bonanza. On earnings, the largest AI infrastructure spenders (Google (GOOGL), Amazon (AMZN), Microsoft (MSFT), and Meta (META)) can still look reasonably valued relative to their growth rates and historical averages, trading at an earnings yield of 3.76% (P/E equivalent of 26.6x), which is 5% above the group's trailing five-year average of 3.57% (P/E equivalent of 28.0x). In other words, the group is trading roughly in line (or at a slight discount) to historical levels. FCF yields, on the other hand, paint a different picture. The cohort is producing strong reported earnings growth, but free cash flow has come under immense pressure as AI-related capex has accelerated. This produces a current average FCF yield of 1.57%, which is 46% below their trailing five-year average of 2.92%, as noted in the "Hyperscaler FCF and Earnings Yields Diverge Amid AI Capex Splurge" chart.
Hyperscaler FCF and Earnings Yields Diverge Amid AI Capex Splurge
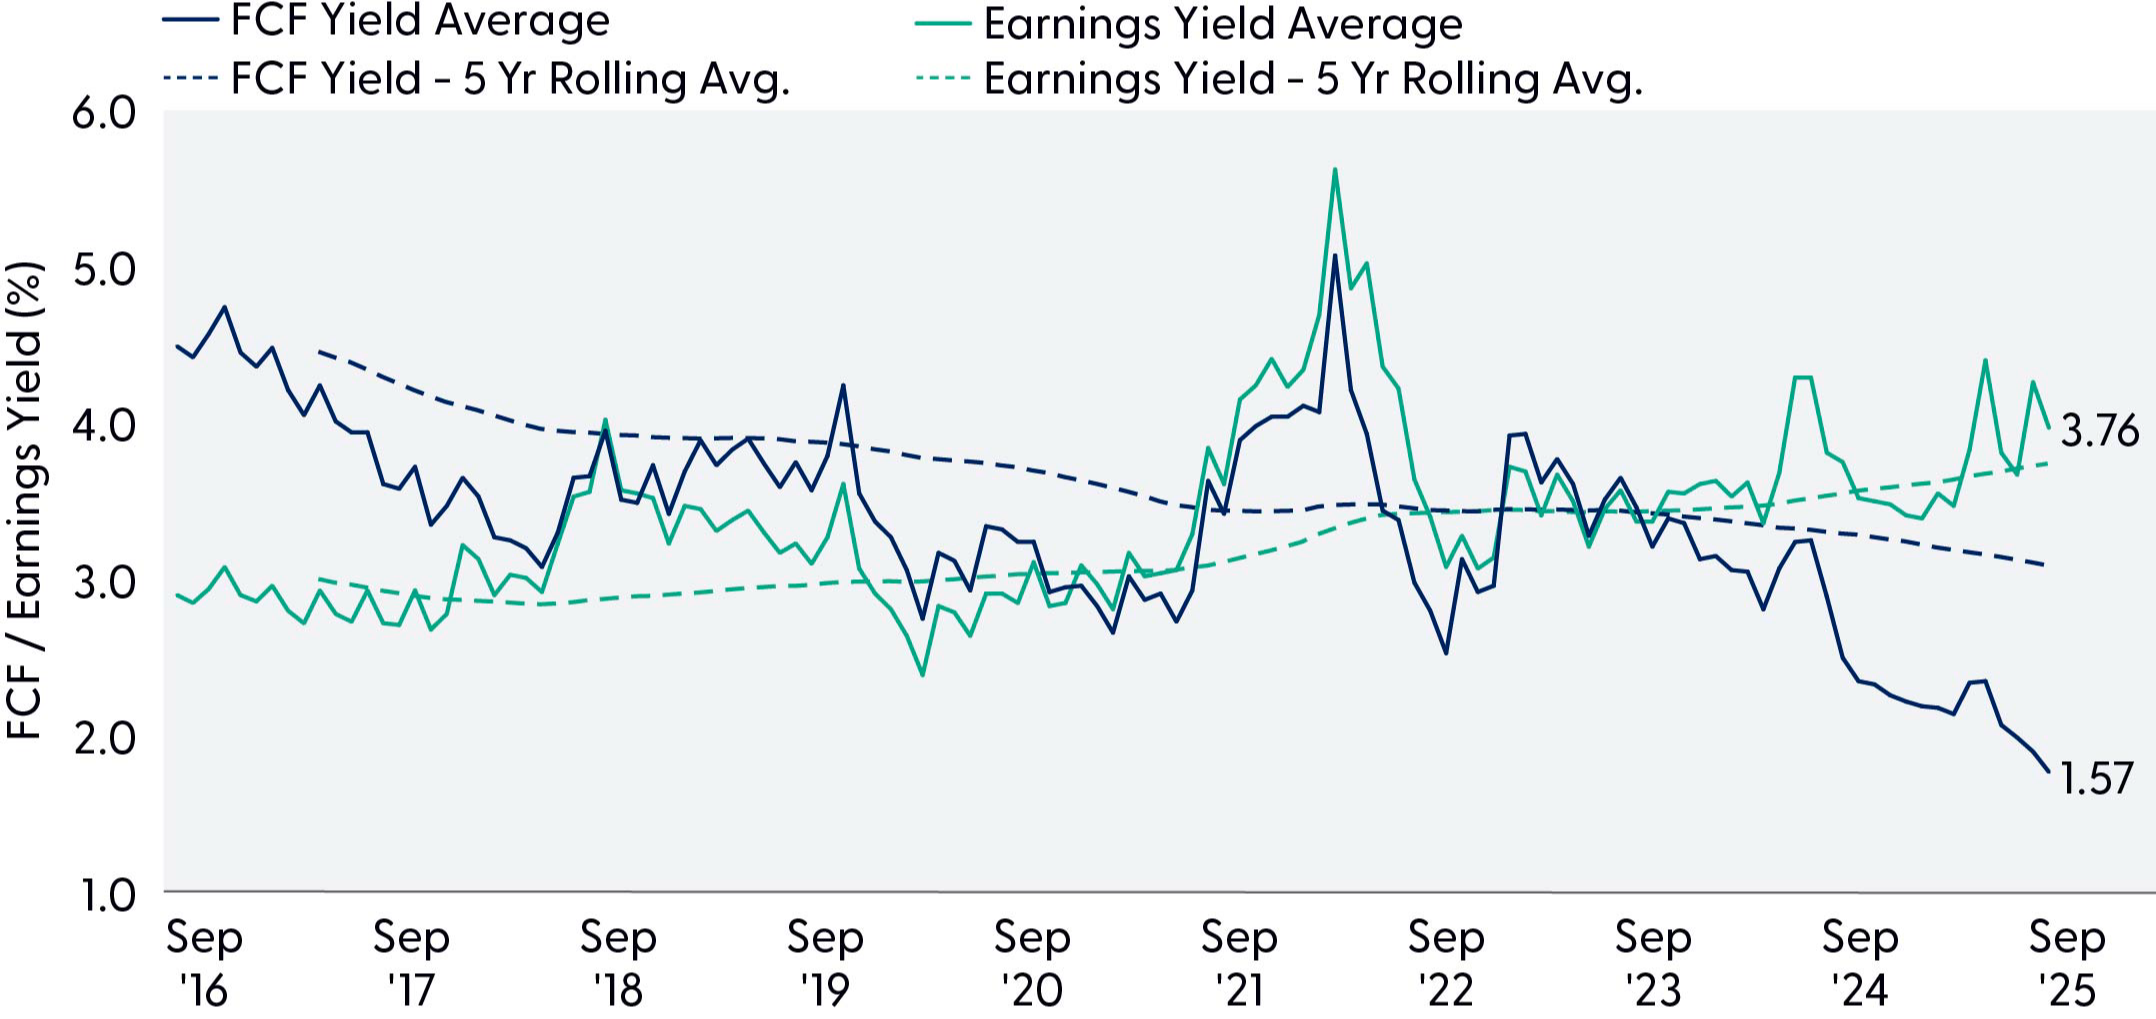
Source: LPL Research, Bloomberg 08/25/26; Average LTM FCF and earnings yields, Monthly, 09/30/16-08/25/26
Disclosures: Past performance is no guarantee of future results.
*Hyperscaler cohort includes GOOGL, AMZN, MSFT, META.
Furthermore, when looking over the last 10 years, FCF and earnings yields largely tracked one another. The divergence we are now seeing shows us what we already know, that the AI buildout has significantly changed the cash flow profile of these businesses. And as that divergence has expanded year to date, the stocks have collectively underperformed the S&P 500, with just one of the four (AMZN) slightly outpacing the broader market. The current regime's preference for cash flow expresses itself yet again, among some of the largest and most widely followed stocks in the market.
The hyperscaler capex and free cash flow story is fully appreciated by investors, so we won't belabor the point too much. We will note that negative free cash flow, which consensus estimates expect for most of the hyperscalers in calendar 2026, is not a bad thing in and of itself. If the return on invested capital (ROIC) clears the cost of capital and the expected returns from competing capital projects, then the spending is not only fine, but encouraged. That is the unknown variable here, of course, and we have our doubts on the value creation in the pure finance textbook sense.
While it's not out of the ordinary that the capital spending dollars are only partially reflected as depreciation expenses for hyperscaler earnings but fully recorded as revenue for the "picks and shovels" providers (primarily semiconductor companies), the size of this mismatch, as well as the outsized influence both the hyperscalers and the semiconductor companies have on index level earnings growth is out of the ordinary. Food for thought for the record earnings growth narrative.
Tying this back to what the FCF yield factor has identified in this environment, the capital-cycle risk with the hyperscalers is that spending has been pulled forward faster than monetization, GAAP earnings will lag the deterioration in economic returns, all while FCF provides investors with plenty of advance warning. This pattern is familiar across capital cycles. Telecom networks in the late 1990s, semiconductor capacity in the early 2000s, and shale oil in the early 2010s all involved real demand and large capital commitments. But when too much capital chases an opportunity all at once, future returns typically underwhelm for the capital providers. FCF yield is useful in precisely these moments, as it forces investors to ask whether reported growth is translating into owner cash.
Conclusion
Earnings tell us what the accounting system recognizes today, while free cash flow tells us what remains after the business funds itself. In periods when capital is cheap and growth is scarce, investors may be willing to look far into the future and pay for earnings potential, as we saw with growth index outperformance in the 2010s and the early part of the 2020s. But in periods when capital intensity rises and the cost of capital matters again, cash flow discipline reasserts its importance. To drive the point home, a quote widely attributed to, and certainly championed by Warren Buffett, "cash is a fact, profit is an opinion".
And we believe the recent value rotation has only just begun. However, we aren't leaning into style-box definitions of value or growth. Instead, we focus on cash generation, self-funded growth investment, and economic value creation. There are plenty of ways for investors to implement value in this manner; via systematic expressions like factor investing, or via individual fundamental business analysis a la the Oracle of Omaha. However you apply value principles to your investment portfolio, we simply suggest keeping this north star in mind over time, intrinsic value is paid in cash.
Asset Allocation Insights
LPL's Strategic and Tactical Asset Allocation Committee (STAAC) maintains its recommendation for a tactical equity overweight and fixed income underweight. We believe an improving macro backdrop and sustained AI-driven earnings growth will continue to support the broader equity market through the remainder of 2026. The Committee recently shifted the implementation of the equity overweight from low-volatility strategies to a quality-factor tilt to enable greater upside participation and allow portfolios to diversify between the AI theme and potential rotation beneficiaries. We continue to favor the industrials and energy sectors, providing a modest tilt toward value-style industry groups. Industrial companies, which offer a lower beta way to benefit from the AI infrastructure buildout, are displaying strong earnings momentum and a favorable technical backdrop in aggregate. Our energy overweight stems from our belief that oil prices may remain higher for longer given the ongoing production and shipping disruptions in the Mideast, offering a desirable hedge against the potential for additional delays in restoring global production.
Tom Shipp, CFA, Head of Equity Research, LPL Financial
Tucker Beale, Sr. Equity Research Analyst, LPL Financial
Important Disclosures
This material is for general information only and is not intended to provide specific advice or recommendations for any individual. There is no assurance that the views or strategies discussed are suitable for all investors or will yield positive outcomes. Investing involves risks including possible loss of principal. Any economic forecasts set forth may not develop as predicted and are subject to change.
References to markets, asset classes, and sectors are generally regarding the corresponding market index. Indexes are unmanaged statistical composites and cannot be invested into directly. Index performance is not indicative of the performance of any investment and do not reflect fees, expenses, or sales charges. All performance referenced is historical and is no guarantee of future results.
Any company names noted herein are for educational purposes only and not an indication of trading intent or a solicitation of their products or services. LPL Financial doesn't provide research on individual equities.
All information is believed to be from reliable sources; however, LPL Financial makes no representation as to its completeness or accuracy.
All investing involves risk, including possible loss of principal.
Important Scenario Analysis Disclosure: The analyses, scenarios, projections, and estimated returns discussed herein are hypothetical, are based on assumptions and estimates, and are provided solely for illustrative and educational purposes. The hypothetical “average hyperscaler” referenced in this report does not represent an actual company, portfolio, account, or investment product. Results shown are not forecasts or guarantees of future performance and are not intended to predict or project the performance of any specific security, company, sector, or market. Actual results may differ materially due to changes in economic conditions, competitive dynamics, technology adoption, capital spending, utilization rates, pricing, regulation, operating costs, and other factors.
The hypothetical results shown were not achieved by any actual investment strategy, account, or client and should not be viewed as indicative of actual investment results.
The Russell 1000 Index consists of the 1,000 largest companies by market capitalization in the Russell 3000 Index, which represents approximately 90% of the total market capitalization of the Russell 3000 Index. It is a large-cap, market-oriented index and is highly correlated with the S&P 500 Index.
Asset allocation does not ensure a profit or protect against a loss. There is no guarantee that a diversified portfolio will enhance overall returns or outperform a non-diversified portfolio. Diversification does not protect against market risk.
Beta measures a portfolio's volatility relative to its benchmark. A beta greater than 1 suggests the portfolio has historically been more volatile than its benchmark. A beta less than 1 suggests the portfolio has historically been less volatile than its benchmark.
US Treasuries may be considered “safe haven” investments but do carry some degree of risk including interest rate, credit, and market risk. Bonds are subject to market and interest rate risk if sold prior to maturity. Bond values will decline as interest rates rise and bonds are subject to availability and change in price.
The Standard & Poor's 500 Index (S&P500) is a capitalization-weighted index of 500 stocks designed to measure performance of the broad domestic economy through changes in the aggregate market value of 500 stocks representing all major industries.
The PE ratio (price-to-earnings ratio) is a measure of the price paid for a share relative to the annual net income or profit earned by the firm per share. It is a financial ratio used for valuation: a higher PE ratio means that investors are paying more for each unit of net income, so the stock is more expensive compared to one with lower PE ratio.
Earnings per share (EPS) is the portion of a company's profit allocated to each outstanding share of common stock. EPS serves as an indicator of a company's profitability. Earnings per share is generally considered to be the single most important variable in determining a share's price. It is also a major component used to calculate the price-to-earnings valuation ratio.
All index data from FactSet or Bloomberg.
This research material has been prepared by LPL Financial LLC.
Not Insured by FDIC/NCUA or Any Other Government Agency | Not Bank/Credit Union Guaranteed | Not Bank/Credit Union Deposits or Obligations | May Lose Value
RES-0007122-0526 Tracking #1166817 | #1166822 (Exp. 08/27)